

Koala supports a wide variety of reporting and visualization choices. Reports and visuals are automatically updated when new data becomes available, or when data is enriched by analysts.
An intuitive and user-friendly web-based reporting engine is part of the Koala Analytics Platform. It can be used to provide interactive reports with advanced visuals to an unlimited number of users. The reports are web-delivered and optimized for mobile devices. AI-based automated reports can be created with just a few clicks for immediate insights.
The reporting system is tightly integrated with Microsoft Office, and reports can be exported to Excel or PowerPoint. Excel provides native integration with the Koala data cloud, and allows the creation of interactive dashboards that automatically update when the underlying data is updated or modified. If you already have Excel-based dashboards and reports, you can connect them to Koala without having to change your end users’ experience.
Koala partners with most third-party analysis and visualization tools including PowerBI, Tableau, and Spotfire. Data automatically flows from the Koala platform into those tools, and existing analyses and dashboards can be connected to Koala data sources.
Flexible Web-Based Reporting
|
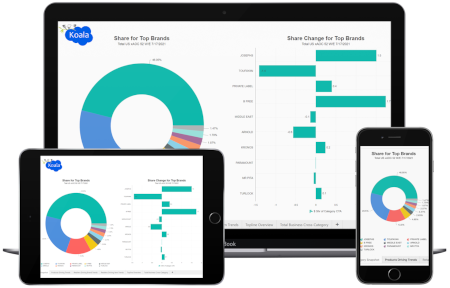
Koala provides web-delivered reports with advanced visualization capabilities. Analysts can use built-in automated reporting, or use the intuitive report building interface to create custom reports and dashboards. Reports are dynamic – with a single click of a mouse, the view can be shifted to show a different geography, brand, or time period. And reports automatically update when new data is available, or when analysts enrich the underlying data.
With Koala’s built-in collaboration ability, teams of analysts can work together on creating and enhancing reports. Granular access control lets different groups of analysts and viewers see all of the reports they need to see, but only the reports they need to see. Analysts can share their reports with an unlimited number of viewers. Any report can be exported to Excel or PowerPoint, or the Koala reporting interface can be put into full-screen mode to give a live presentation from inside a web browser. Koala reports can be viewed on mobile devices, and analysts can work with their reports on tablets and smartphones. |
|
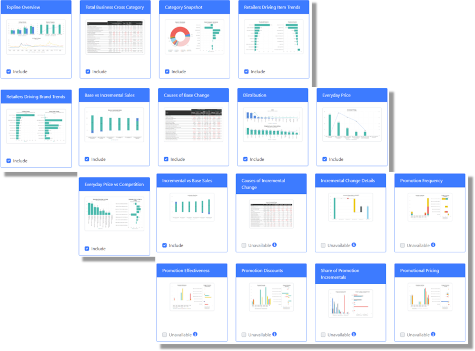
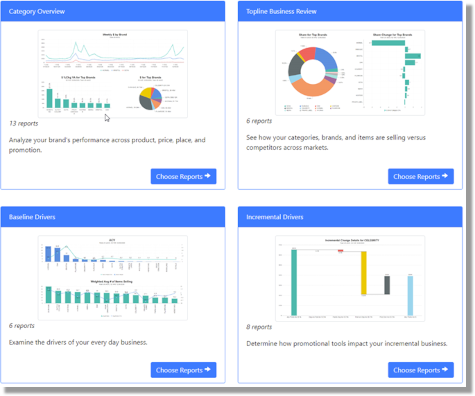
Automated Reports
|
Tight Integration with Microsoft Office
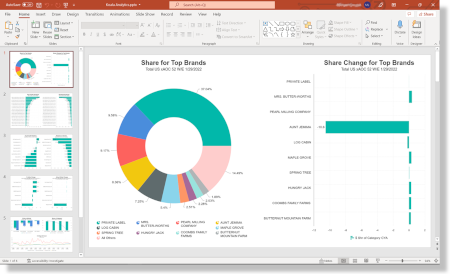
Any Koala report can be exported directly to Excel or PowerPoint. Slide decks consisting of multiple reports can be exported in a single operation, allowing quick and easy generation of sales presentations.
Koala’s intuitive reporting interface is completely self-serve, so business managers and sales staff can generate their own slide decks as they need them.
An iterative output option provides a simple way to generate large sets of slides or reports that cover all (or just some) of your markets, brands, or reporting periods.
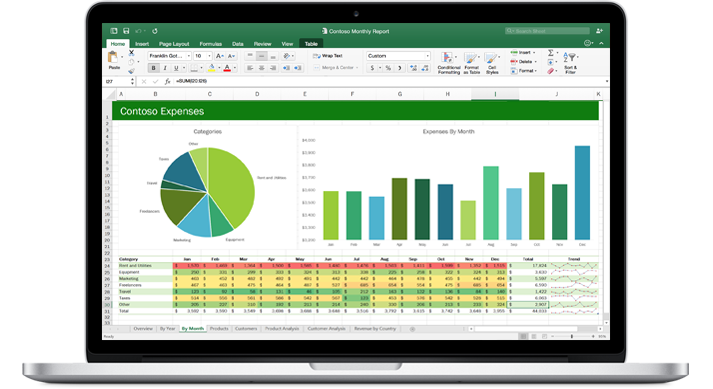
Cloud-Backed Excel Reporting
|
Microsoft Excel natively integrates with the Koala data cloud, allowing the distribution of interactive reports to an unlimited number of viewers. If your organization already uses Excel dashboards and reporting, you can plug them into Koala and get access to the advantages of cloud-backed data without having to change the deliverables your users are accustomed to seeing.
The benefits of switching to Koala cloud-backed Excel include:
|
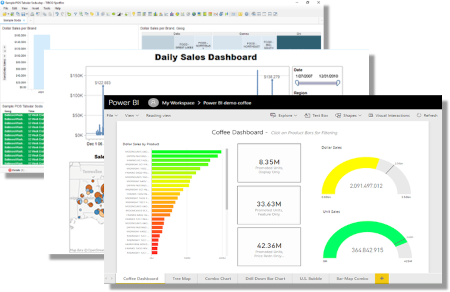
Connect to Visualization Tools
|
Koala partners with most popular 3rd party data visualization and exploration tools. Combining the Koala platform with these tools gives them access to large disparate data sets and CPG-specific data enhancements.
You can connect tools such as PowerBI, Tableau, and Spotfire directly to your Koala data cloud without needing to purchase and install any additional add-ins. Koala’s open data platform supports most data and visualization software, including internally developed applications. If you already have dashboards, reporting, or analytics created in one of these tools, you can protect that investment while gaining access to improved data handling and other advanced features. When data is updated or enriched in a Koala data source, those changes automatically flow through into any connected tools and the visualizations/reporting they provide. |
|